THE QUARTERLY COMPASS ASPIRA WEALTH – Q1 2025
In-depth stock market analysis from your wealth advisory team - Aspira Wealth from Victoria, BC. Written by Alex Vozian, co-founder, and portfolio manager of Aspira Wealth.
THE Big 6 TAKEAWAYS + 1 BONUS
-
The recent stock market decline is the opportunity that long term investors have been waiting for!
We mentioned the high likelihood of a 5-10% stock market decline in the past editions of our Quarterly Compass. While it is impossible to predict the timing and magnitude of the market declines, they are a normal part of the market cycle. That is the best time to add new money to your investment accounts that will be gradually invested during the next few months, at more attractive prices compared to the last few quarters. This is exactly what my family plans to do with any excess cash.
-
Yes, it is scary... and that is exactly why the opportunity exists in the first place.
Yes, it is scary... and that is exactly why the opportunity exists in the first place.
Stock markets are on sale when things are scary. You may remember the 2008 financial crisis or the 2020 healthcare crisis, for example. The current market decline is another such moment, driven by the U.S. policy shocks of 2025 (primarily tariffs) and the possible over-investment in AI technology.
-
We would be surprised to witness more than an additional 10% market decline in 2025, for several reasons.
We would be surprised to witness more than an additional 10% market decline in 2025, for several reasons.
As of Monday April 7th morning, U.S. market (SPY ETF) is down 17% from 2025 record high. Canadian market (XIC.TO ETF) is down 10% from 2025 high.
Remember - there is no way to guess how long and deep this market decline will be. However, we are optimistic about the following:
- Extreme fear. The volatility index ($VIX), AAII Investor Sentiment Survey, Fear and Greed Index, and even an unusually high number of clients’ calls are confirming that fear level is highest since early 2020.
- Extreme economic uncertainty, reflected by the Global Economic Policy Uncertainty Index. The last number is from January 2025 (well before tariffs’ announcement in April) and it was the highest since at least early 1997. It is hard to imagine a larger level of uncertainty on so many fronts at the same time: trade, immigration, fiscal policy, regulation, and defence.
- We assume that reduction in U.S. tariffs is more likely than not. Why? U.S. Administration might be willing to negotiate and... the economic damage from the tariffs might force U.S. to soften the tariffs.
- Even if tariffs remain as announced on April 3, the U.S. administration plans to lower income taxes – that would help consumers and businesses offset the pain from tariffs.
- Even if the lower taxes do not help, U.S. Federal Reserve might be willing to lower interest rates, to help the country deal with the side effects of the changes in U.S. trade policy.
-
We were proactive before the April 2025 market correction.
We were proactive before the April 2025 market correction.
Well before the recent correction, we lowered our exposure to the U.S. market, including exposure to technology sector (we even exited our long-term holding Microsoft – the only holding from “Magnificent 7”).
At the same time, we increased our exposure to safer sectors, like healthcare and gold/silver companies. We also added modest exposure to China and Germany on assumptions that recently announced economic stimulus could help these two markets to outperform U.S. and Canada in the short/medium term.
-
Our priority for Q2 2025 is taking advantage of lower stock prices.
Our priority for Q2 2025 is taking advantage of lower stock prices.
Our core strategy, the Dividend Value Discipline™, has between 5-9% cash exposure, while newer clients may have a larger cash exposure. It is our intention to spend a third or half of that cash in the next few days and spend more if market conditions become even more attractive.
-
The short-term pain caused by the U.S. administration may lead to some long-term gain, potentially benefiting both the U.S. and the rest of the world.
The short-term pain caused by the U.S. administration may lead to some long-term gain, potentially benefiting both the U.S. and the rest of the world.
Uncertainty and global trade barriers are slowing economic growth, but these events might help the U.S. reduce its fiscal and trade deficits in the long run. Additionally, a regional or global recession (if any) could lower the interest costs on U.S. debt, providing some relief.
BONUS: The hairdresser’s sell signal was correct, but I regret I didn’t listen to it enough!
On February 11th, I emailed my colleagues about my wife’s visit to a hairdresser. The hairdresser told my wife that she had doubled her money since 2022 by buying several large U.S. companies, and she was very curious if my wife was missing out on similar opportunities. This is exactly in line with the saying, “when your barber is telling you to buy a stock, you sell it.”
INVESTMENT PERFORMANCE – ASPIRA WEALTH IN-HOUSE STRATEGIES – RJL only
The performance reported below does not include RJLU numbers, due to compliance reasons. For RJLU clients, please check your individual accounts for performance reporting.
The Q1 2025 returns in strategies of Aspira Wealth ranged from -2.6% to +1.9%.
In early April 2025, both Aspira strategies and stock markets have declined significantly.
We place no weight on short-term results, good or bad, and neither should you. We believe that our long-term focus will serve us better.

Source: Aspira Wealth. *These numbers are relevant only for accounts with Raymond James Ltd. (Canada).
BROAD MARKET OBSERVATIONS
CANADIAN STOCK MARKET
- In Q1 2025 the Canadian stock market (S&P/TSX) increased by 1.5%. But the market decline from early April 2025 erased all Q1 2025 gains and about a half of the gains earned in 2024, despite the fact that U.S. tariffs on imports from Canada were better than feared.
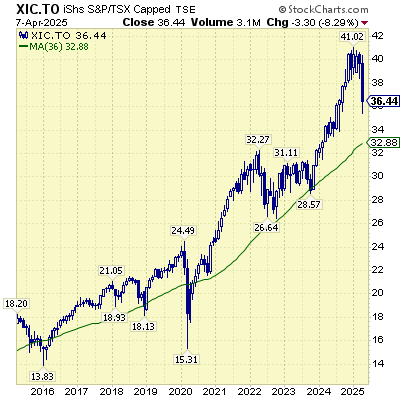
Chart courtesy of StockCharts.com
U.S. STOCK MARKET
- In Q1 2025 the U.S. stock market (SPY ETF) declined by 4.3%. With the additional losses from early April 2025, the market lost most of the gains earned in 2024.
- S. companies and consumers are dealing with an unprecedented level of uncertainty on so many fronts at the same time: trade, immigration, fiscal policy, regulation, and defence. Investors, businesses, and consumers do not like uncertainty, and it is well reflected in the stock market.
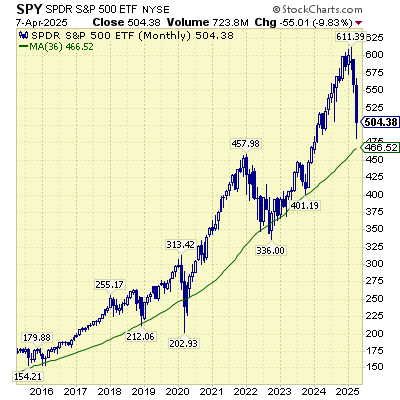
Chart courtesy of StockCharts.com
USD CAD Exchange Rate
- The U.S. dollar moved significantly compared to the Canadian dollar since our last update but remained within its 10-year range of 1.20-1.50 CAD/USD, despite all the uncertainty.
- Since we expect it to stay in the same range in the long-term, we are comfortable investing 50-75% of our Dividend Value Discipline™ portfolios in U.S. stocks, for a bigger diversification effect compared to the Canadian stock market.
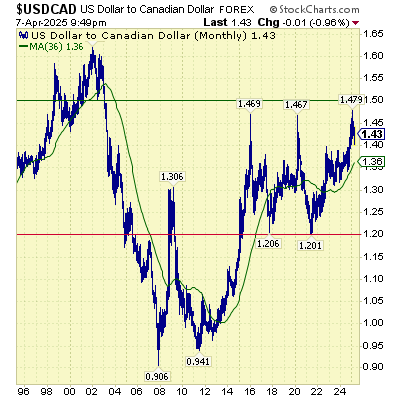
Chart courtesy of StockCharts.com
Copper Price – one of the world’s leading economic indicators
- During Q1 2025, the copper price set an all-time high of $5.4, meeting our prediction that it will trade above $5. Copper gave up most Q1 2025 gains in early April 2025. Copper price is assumed to predict turning points in the global economy, since it is widely used in most economic sectors. The April decline is reflecting the clouded outlook for global economy, due to U.S. policy uncertainty.
- We continue to believe that long-term fundamentals of copper are great and expect copper prices to exceed the $5 level during the next three years. New copper deposit discoveries are limited while the world needs a lot of copper to build and power electrical vehicles, as well as artificial intelligence data centres worldwide. The temporary headwinds in copper demand are partially offset by imminent increase in defence spending in several European countries.
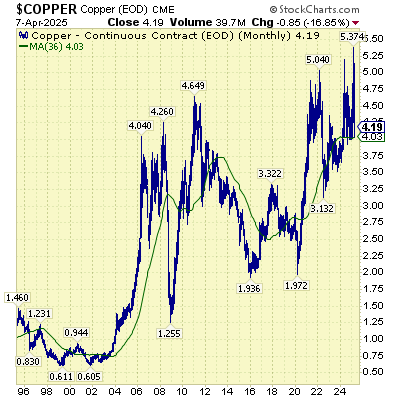
Chart courtesy of StockCharts.com
Semiconductors stocks – one of world’s leading economic indicators focused on the “new” economy
- Q1 2025 was a terrible quarter for semiconductor stocks, as we expected, after multiple years of outperformance. The market participants are worried about excessive inventory in traditional semiconductor space, and the long-term payoff of massive investments in AI space.
- The Semiconductor ETF has more than erased all 2024 gains during early 2025.
- DeepSeek – a Chinese AI company – surprised the market in early 2025 with a surprisingly efficient technology compared to Western alternatives.
- According to our internal research, the investments in data centers in U.S. may have peaked in Q3 2024, while there are already some data center project cancelation stories in the news.
- We continue to have a very modest exposure to this space in all our investment strategies.
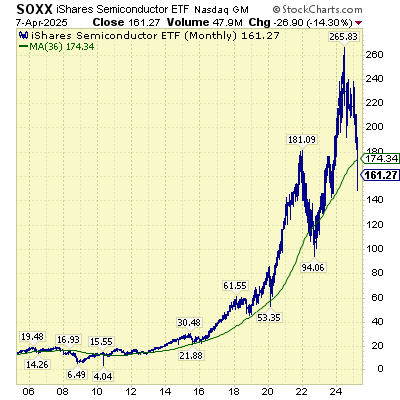
Chart courtesy of StockCharts.com
Crude oil prices
- Since the start of 2025, the U.S. oil price (WTI) declined from the high of $79 to current level of $62. Uncertainty originating from new U.S. administration is affecting all fields, including energy resources like oil.
- We continue to expect U.S. oil price (WTI) to remain volatile, in the wide range of $60-100 per barrel. We would not be surprised to see the price below $60 for brief periods of time, but we think it is unlikely to stay below $60 for a long time considering the low investments in production capacity in the past 10 years. We do not expect it to go above $100, because higher prices encourage larger supplies and given the efforts to transition to cleaner energy.
- We would be remiss if we did not point out that the wide Western Canada Select discount versus the benchmark West Texas Intermediate has narrowed considerably because of TMX getting us to tidewater. This is highly favourable to Canadian oil producers (as is our weak $) and speaks to Canada’s need for more tidewater pipelines.
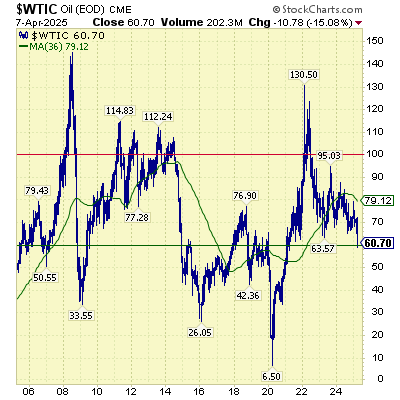
Chart courtesy of StockCharts.com
U.S. natural gas price
- In Q1 2025, the price of natural gas hit the 2-year high level of $4.6 but gave up some of the gains in last few weeks.
- We continue to expect it to stay in a wide range of $3-5 per MCF during the next five years (the natural gas prices are oscillating more than oil prices, due to exposure to the weather / heating season).
- AI data centers are energy-intensive, and we see natural gas-fired power plants as a reliable and scalable solution to meet this growing demand. Compared to natural gas, the nuclear power plants take longer to start, and solar/wind energy sources don’t provide a consistent supply.
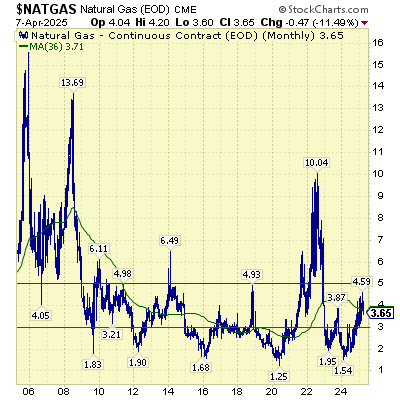
Chart courtesy of StockCharts.com
WORRY JOURNAL - TOP WORRIES OF MARKET PARTICIPANTS AND BUSINESS LEADERS IN 2025
Current worries:
Trump 2.0 - Tariffs / Immigration / Government Overhaul / Tax cuts.
We were wrong to assume that U.S. will use tariffs purely for negotiating better trade conditions with rest of the world. While U.S. administration may choose to take a less aggressive stance later this year, as of today it is surprisingly aggressive and exceeding most of the predictions, including our own.
We included our current thoughts on tariffs at the beginning of this publication.
Older worries covered in detail in our recent publications:
- Israel – Hamas/Gaza military conflict is spreading in the region (2024+)
- Artificial Intelligence (AI) bubble (2024+)
- S. Elections (2024)
- Delay in S. interest rate cuts (2024)
- Nothing to fear but nothing to fear (2024).
- Risks and Dangers of Artificial Intelligence (AI) (2023+).
- 2023 Israel–Hamas war (2023+)
- Economic slowdown/recession (2022+)
- Debt ceiling debate/potential of a U.S. default (2023)
- War in Ukraine (2022+)
- Inflation (2021+)
- Supply chain disruption caused by the pandemic, geopolitical events (2020+).
- Labour shortages, attracting and retaining talent (2020+).
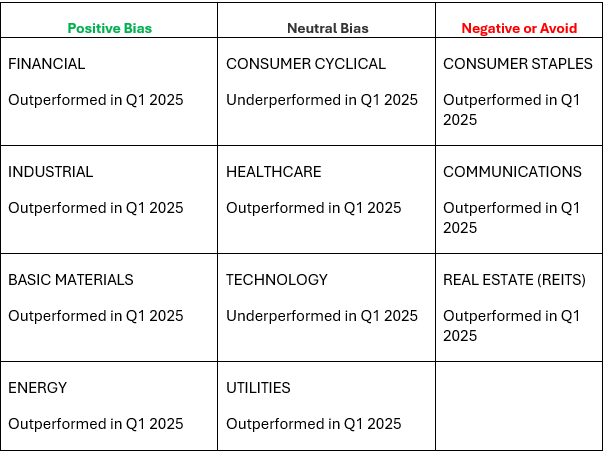
SECTOR POSITIONING FOR THE DIVIDEND VALUE DISCIPLINETM
- We are reiterating our sector biases this quarter. We are pleased with our downgrade of Technology and upgrade of Financial sectors that we mentioned a quarter ago.
- The rest of our assumptions and observations about each sector remain unchanged – you can find them in our previous publications.
Alex Vozian, CFA
Co-Founder and Portfolio Manager of Aspira Wealth
April 7, 2025.
The information contained in this report was obtained from sources believed to be reliable, however, we cannot represent that it is accurate or complete and it should not be considered personal tax advice. This report is provided as a general source of information and should not be considered personal investment advice or solicitation to buy or sell securities. The views expressed are those of the author and not necessarily those of Raymond James. We are not tax advisors, and we recommend that clients seek independent advice from a professional advisor on tax-related matters. This provides links to other Internet sites for the convenience of users. Raymond James Ltd./Raymond James (USA) Ltd is not responsible for the availability or content of these external sites, nor does Raymond James Ltd/Raymond James (USA) Ltd endorse, warrant or guarantee the products, services or information described or offered at these other Internet sites. Users cannot assume that the external sites will abide by the same Privacy Policy which Raymond James Ltd/Raymond James (USA) Ltd adheres to. Raymond James Ltd., Member—Canadian Investor Protection Fund. Raymond James (USA) Ltd. (RJLU) advisors may only conduct business with residents of the states and/or jurisdictions for which they are properly registered. Raymond James (USA) Ltd. is a member of FINRA/SIPC.


![]()